Tröbitz
Jump to navigation
Jump to search
Tröbitz | |
|---|---|
 Coat of arms | |
Location of Tröbitz within Elbe-Elster district  | |
 Tröbitz  Tröbitz | |
| Coordinates: 51°36′00″N 13°25′59″E / 51.60000°N 13.43306°E | |
| Country | Germany |
| State | Brandenburg |
| District | Elbe-Elster |
| Municipal assoc. | Elsterland |
| Government | |
| • Mayor (2019–24) | Holger Gantke[1] |
| Area | |
| • Total | 10.56 km2 (4.08 sq mi) |
| Elevation | 114 m (374 ft) |
| Population (2022-12-31)[2] | |
| • Total | 682 |
| • Density | 65/km2 (170/sq mi) |
| Time zone | UTC+01:00 (CET) |
| • Summer (DST) | UTC+02:00 (CEST) |
| Postal codes | 03253 |
| Dialling codes | 035326 |
| Vehicle registration | EE, FI, LIB |
Tröbitz is a municipality in the Elbe-Elster district, in Lower Lusatia, Brandenburg, Germany.
History
From 1815 to 1947, Tröbitz was part of the Prussian Province of Brandenburg. From 1952 to 1990, it was part of the Bezirk Cottbus of East Germany.
Demography
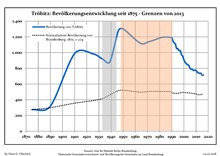
|
|
References
- ^ Landkreis Elbe-Elster Wahl der Bürgermeisterin / des Bürgermeisters, accessed 1 July 2021.
- ^ "Bevölkerungsentwicklung und Bevölkerungsstandim Land Brandenburg Dezember 2022" (PDF). Amt für Statistik Berlin-Brandenburg (in German). June 2023.
- ^ Detailed data sources are to be found in the Wikimedia Commons.Population Projection Brandenburg at Wikimedia Commons
Towns and municipalities in Elbe-Elster | ||
|---|---|---|
|  | |
| International | |
|---|---|
| National | |
| Geographic | |
This Brandenburg location article is a stub. You can help Wikipedia by expanding it. |
Categories:
- Pages using gadget WikiMiniAtlas
- CS1 German-language sources (de)
- Articles with short description
- Short description is different from Wikidata
- Coordinates on Wikidata
- Municipalities in Brandenburg
- Articles with VIAF identifiers
- Articles with GND identifiers
- Articles with J9U identifiers
- Articles with LCCN identifiers
- Articles with MusicBrainz area identifiers
- Localities in Elbe-Elster
- All stub articles
- Brandenburg geography stubs