Oberkrämer
Jump to navigation
Jump to search
Oberkrämer | |
|---|---|
 Church in Vehlefanz | |
 Coat of arms | |
Location of Oberkrämer within Oberhavel district  | |
 Oberkrämer  Oberkrämer | |
| Coordinates: 52°42′N 13°06′E / 52.700°N 13.100°E | |
| Country | Germany |
| State | Brandenburg |
| District | Oberhavel |
| Subdivisions | 7 districts |
| Government | |
| • Mayor (2022–30) | Wolfgang Geppert[1] |
| Area | |
| • Total | 103.67 km2 (40.03 sq mi) |
| Elevation | 54 m (177 ft) |
| Population (2022-12-31)[2] | |
| • Total | 12,145 |
| • Density | 120/km2 (300/sq mi) |
| Time zone | UTC+01:00 (CET) |
| • Summer (DST) | UTC+02:00 (CEST) |
| Postal codes | 16727 |
| Dialling codes | 03304 |
| Vehicle registration | OHV |
| Website | www.oberkraemer.de |

Oberkrämer is a municipality in the Oberhavel district, in Brandenburg, Germany. An experimental farm of wind turbines existed between 1941 and 1945 on the 50 m high Matthias mountain in the area.
Subdivisions
Oberkrämer consists of formerly separate municipalities, which as of 31 December 2001 merged with the new municipality of Oberkrämer.
On 27 September 1998, the municipalities of Eichstädt, Neu-Vehlefanz and Vehlefanz merged into the new municipality of Oberkrämer. On 31 December 2001, the municipalities of Bärenklau, Bötzow, Marwitz and Schwante were merged into the municipality of Oberkrämer.
Demography
-
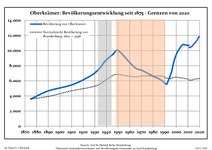 Development of population since 1875 within the current Boundaries (Blue Line: Population; Dotted Line: Comparison to Population development in Brandenburg state; Grey Background: Time of Nazi Germany; Red Background: Time of communist East Germany)
 -
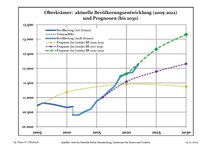 Recent Population Development and Projections (Population Development before Census 2011 (blue line); Recent Population Development according to the Census in Germany in 2011 (blue bordered line); Official projections for 2005-2030 (yellow line); for 2020-2030 (green line); for 2017-2030 (scarlet line)


|
|
|
Photogallery
- Schwante
-
 Manor
Manor -
 Park
Park -
 Former water tower


References
- ^ Landkreis Oberhavel Wahl der Bürgermeisterin / des Bürgermeisters, accessed 13 November 2022.
- ^ "Bevölkerungsentwicklung und Bevölkerungsstandim Land Brandenburg Dezember 2022" (PDF). Amt für Statistik Berlin-Brandenburg (in German). June 2023.
- ^ Detailed data sources are to be found in the Wikimedia Commons.Population Projection Brandenburg at Wikimedia Commons
External links
![]() Media related to Oberkrämer at Wikimedia Commons
Media related to Oberkrämer at Wikimedia Commons
Towns and municipalities in Oberhavel | ||
|---|---|---|
 | ||
| International | |
|---|---|
| National | |
This Brandenburg location article is a stub. You can help Wikipedia by expanding it. |
Categories:
- CS1 German-language sources (de)
- Articles with short description
- Short description is different from Wikidata
- Coordinates on Wikidata
- Municipalities in Brandenburg
- Commons category link from Wikidata
- Articles with VIAF identifiers
- Articles with GND identifiers
- Localities in Oberhavel
- All stub articles
- Brandenburg geography stubs