File:Svalbard temperature.png
Original file (976 × 579 pixels, file size: 96 KB, MIME type: image/png)
Summary
| Description |
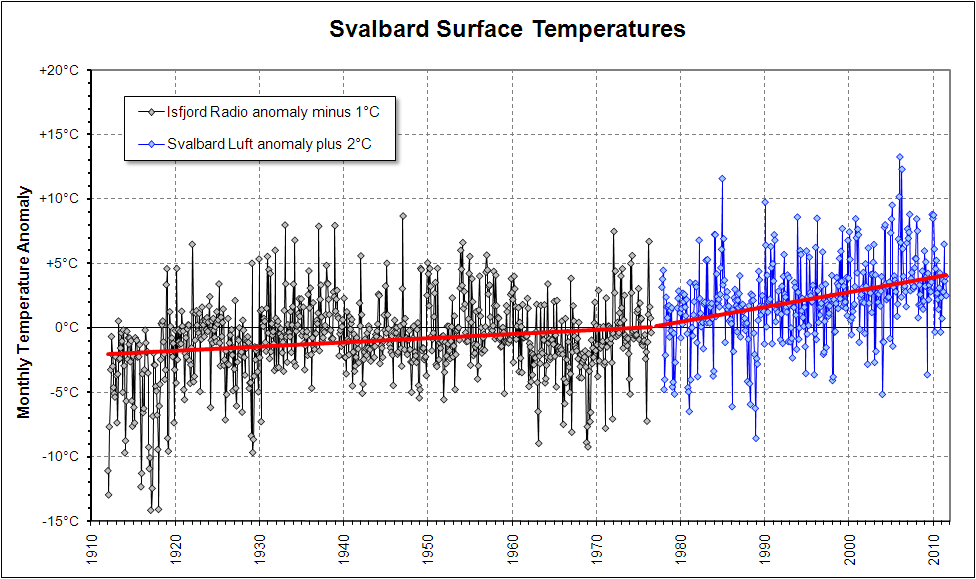
Svalbard surface temperature mean monthly anomalies 1912 to 2011, in °C. Anomalies are station monthly temperatures minus the local average for the month. The recording station moved some 47 km from Isfjord Radio (78.1°N, 13.6° E) to Svalbard Luft (78.2°N, 15.5°E) in 1976, with little record overlap. There is an obvious station temperature difference, here largely removed by plotting anomalies from monthly averages instead of the raw temperatures. A common base period for computing anomalies is not available because of the lack of record overlap. The base intervals used here are 1912-1976 for Radio and 1978-2007 for Luft (both near to the local full record). Because of the differing base intervals, the long-term uptrend results in a substantial step change in anomaly (circa 3°C) at the station change. To produce an indicative combined anomaly plot, the difference is here crudely adjusted by moving Radio down by 1°C and Luft up by 2°C, so that the trend lines meet at the station change. The resulting zero crossing is near 1975, so the plotted anomalies relate approximately to the commonly adopted 1960-90 interval. The Svalbard record shows one of the strongest long-record warming trends on Earth, in close agreement with the pattern of climate model predictions. |
| Date | 28 September 2006 (original upload date) |
| Source | No machine-readable source provided. Own work assumed (based on copyright claims). |
| Author | No machine-readable author provided. Glen Fergus assumed (based on copyright claims). |
Source
Data from NASA GISS Surface Temperature Analysis.
Licensing
- You are free:
- to share – to copy, distribute and transmit the work
- to remix – to adapt the work
- Under the following conditions:
- attribution – You must give appropriate credit, provide a link to the license, and indicate if changes were made. You may do so in any reasonable manner, but not in any way that suggests the licensor endorses you or your use.
- share alike – If you remix, transform, or build upon the material, you must distribute your contributions under the same or compatible license as the original.
File history
Click on a date/time to view the file as it appeared at that time.
| Date/Time | Thumbnail | Dimensions | User | Comment | |
|---|---|---|---|---|---|
| current | 05:02, 30 August 2011 | | 976 × 579 (96 KB) | commons>Glen Fergus | Update |
File usage
There are no pages that use this file.