File:Piecharts.svg
Jump to navigation
Jump to search

Size of this PNG preview of this SVG file: 689 × 494 pixels. Other resolutions: 320 × 229 pixels | 640 × 459 pixels | 1,024 × 734 pixels | 1,280 × 918 pixels | 2,560 × 1,835 pixels.
Original file (SVG file, nominally 689 × 494 pixels, file size: 39 KB)
File history
Click on a date/time to view the file as it appeared at that time.
| Date/Time | Thumbnail | Dimensions | User | Comment | |
|---|---|---|---|---|---|
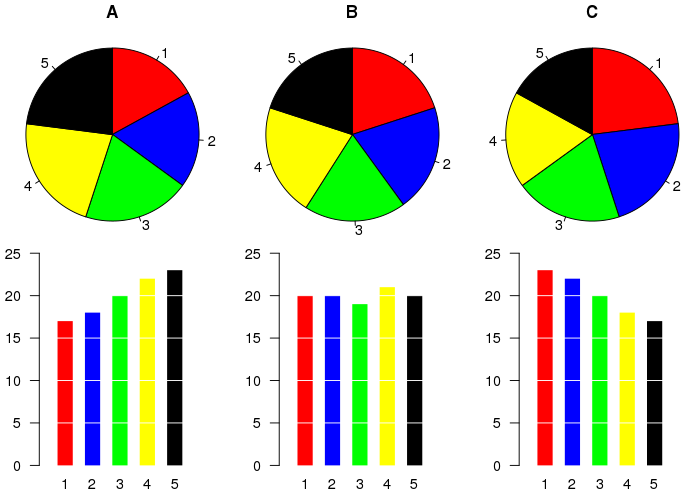
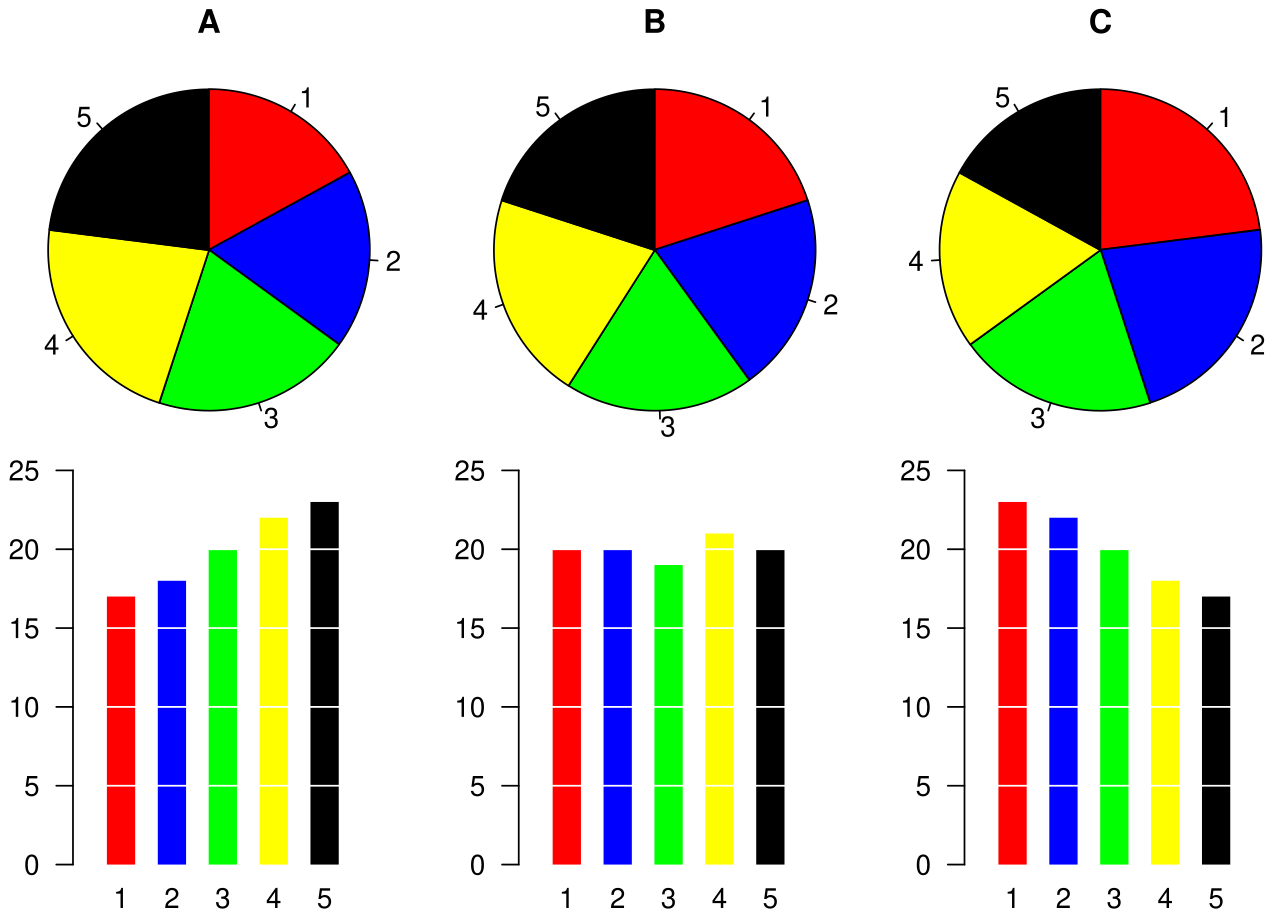
| current | 08:33, 28 August 2007 | | 689 × 494 (39 KB) | commons>Schutz | == Summary == Example of a pie chart, along with a bar plot showing the same data and indicating that the pie chart is not the best possible chart for this particular dataset. The graphic was created by User:Schutz for Wikipedia on 28 August 2007 usi |
File usage
There are no pages that use this file.