File:PbSO4 solubility graph.png
Jump to navigation
Jump to search

Size of this preview: 800 × 489 pixels. Other resolutions: 320 × 196 pixels | 640 × 391 pixels | 1,024 × 626 pixels | 1,436 × 878 pixels.
Original file (1,436 × 878 pixels, file size: 12 KB, MIME type: image/png)

|
This graph image could be re-created using vector graphics as an SVG file. This has several advantages; see Commons:Media for cleanup for more information. If an SVG form of this image is available, please upload it and afterwards replace this template with
{{vector version available|new image name}}.
It is recommended to name the SVG file “PbSO4 solubility graph.svg”—then the template Vector version available (or Vva) does not need the new image name parameter. |
Summary
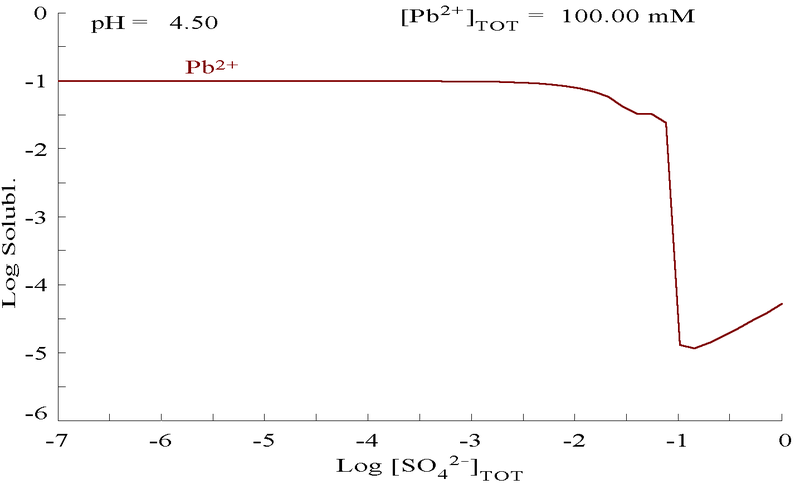
| Description | Plot showing aqueous concentration of dissolved Pb2+ (max available concentration = 0.1M) as a function of SO42− at pH=4.5, which is the max pH at which 0.1M Pb2+ can exist. |
| Date | |
| Source | self-made using Hydra/Medusa software, freely downloadable from [1]. Edited using Gimp 2.2 |
| Author | Karlhahn |
Licensing
| I, the copyright holder of this work, release this work into the public domain. This applies worldwide. In some countries this may not be legally possible; if so: I grant anyone the right to use this work for any purpose, without any conditions, unless such conditions are required by law. |
File history
Click on a date/time to view the file as it appeared at that time.
| Date/Time | Thumbnail | Dimensions | User | Comment | |
|---|---|---|---|---|---|
| current | 11:48, 2 July 2010 | | 1,436 × 878 (12 KB) | commons>Materialscientist | crop whitespace |
File usage
There are no pages that use this file.