No higher resolution available.
This file is from a shared repository and may be used by other projects.
The description on its file description page there is shown below.
License
Attribution 4.0 International (CC BY 4.0)
- &
CC0 1.0 Universal (CC0 1.0) Public Domain Dedication
Summary
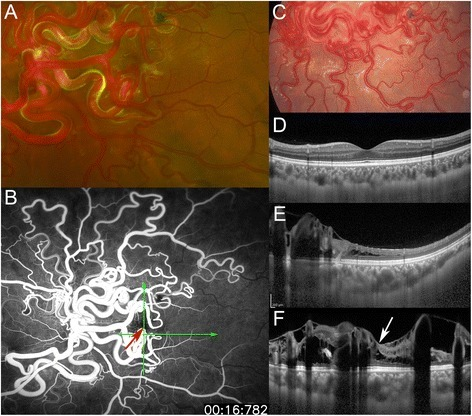
Author:Iwata A, Mitamura Y, Niki M, Semba K, Egawa M, Katome T, Sonoda S, Sakamoto T ,Department of Ophthalmology, Institute of Health Biosciences, The University of Tokushima Graduate School(Openi/National Library of Medicine)Source:https://openi.nlm.nih.gov/detailedresult?img=PMC4359503_12886_2015_14_Fig1_HTML&query=Wyburn-Mason%20syndrome&it=xg&req=4&npos=1 Description:Fig1: Fundus photographs,fluorescein angiographic(FA)image, and enhanced depth imaging optical coherence tomographic(EDI-OCT) images. A: Fundus photograph at age 27 years. Markedly dilated tortuous vascular loops consistent with retinal arteriovenous malformations are distributed from the optic disc over four quadrants in the left eye. Arteries are directly connected to veins without passing through any capillaries. The optic disc is obscured by very large vascular loops. Numerous anastomosing vessels make it difficult to separate the arterial and venous components. B: At age 27 years, wide-field fluorescein angiography in early phase shows fluorescein throughout the vascular loops without an intervening capillary bed and leakage from the loops, indicating a direct arteriovenous communication. Red arrow indicates the fovea (center of the foveal avascular zone), and green arrows indicate the direction of the OCT scans in ‘E’ and ‘F’. C: Fundus photograph at age 11 years. The vascular loops in some areas are less dilated and tortuous than at 27 years in the left eye (see ‘A’). D-F: EDI-OCT images in the healthy right eye (D) and the affected left eye (E, F) at age 27 years. Choroidal thickness of the left eye is thicker than that of the fellow eye. ‘E’ indicates a horizontal scan, and ‘D’ and ‘F’ indicate vertical scans through the fovea. OCT images in the left eye (E, F) demonstrate retinal edema with cystic changes and oval-shaped lesions corresponding to cross sections of abnormal retinal vessels. White arrow indicates cystoid macular edema (F).
File history
Click on a date/time to view the file as it appeared at that time.
| Date/Time | Thumbnail | Dimensions | User | Comment |
|---|
| current | 22:13, 26 November 2021 |  | 472 × 416 (337 KB) | Ozzie10aaaa | Author:Iwata A, Mitamura Y, Niki M, Semba K, Egawa M, Katome T, Sonoda S, Sakamoto T ,Department of Ophthalmology, Institute of Health Biosciences, The University of Tokushima Graduate School(Openi/National Library of Medicine)Source:https://openi.nlm.nih.gov/detailedresult?img=PMC4359503_12886_2015_14_Fig1_HTML&query=Wyburn-Mason%20syndrome&it=xg&req=4&npos=1 Description:Fig1: Fundus photographs,fluorescein angiographic(FA)image, and enhanced depth imaging optical coherence tomographic(EDI-O... |
File usage
There are no pages that use this file.