File:Ohio counties trend 2016-2020.svg
Jump to navigation
Jump to search

Size of this PNG preview of this SVG file: 600 × 600 pixels. Other resolutions: 240 × 240 pixels | 480 × 480 pixels | 768 × 768 pixels | 1,024 × 1,024 pixels | 2,048 × 2,048 pixels | 810 × 810 pixels.
Original file (SVG file, nominally 810 × 810 pixels, file size: 40 KB)
Summary
| Description |
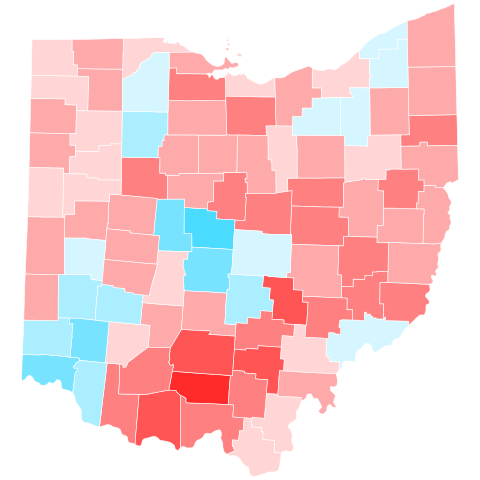
English: This map depicts the trend in each Ohio county from the 2016 to 2020 presidential elections. A county's trend is its shift from 2016-2020 compared to the statewide shift; for example, Ohio's D+0.04 shift from 2016-2020 would make a county whose shift was +0 have a trend of R+0.04 over the same period. |
| Date | |
| Source | Own work |
| Author | Chaidan |
Licensing
I, the copyright holder of this work, hereby publish it under the following license:
This file is licensed under the Creative Commons Attribution-Share Alike 4.0 International license.
- You are free:
- to share – to copy, distribute and transmit the work
- to remix – to adapt the work
- Under the following conditions:
- attribution – You must give appropriate credit, provide a link to the license, and indicate if changes were made. You may do so in any reasonable manner, but not in any way that suggests the licensor endorses you or your use.
- share alike – If you remix, transform, or build upon the material, you must distribute your contributions under the same or compatible license as the original.
File history
Click on a date/time to view the file as it appeared at that time.
| Date/Time | Thumbnail | Dimensions | User | Comment | |
|---|---|---|---|---|---|
| current | 06:25, 19 January 2024 | | 810 × 810 (40 KB) | commons>Chaidan | Uploaded own work with UploadWizard |
File usage
There are no pages that use this file.