File:Graph of emissions by city.jpg
Jump to navigation
Jump to search
Size of this preview: 574 × 600 pixels. Other resolutions: 230 × 240 pixels | 600 × 627 pixels.
Original file (600 × 627 pixels, file size: 46 KB, MIME type: image/jpeg)
File history
Click on a date/time to view the file as it appeared at that time.
| Date/Time | Thumbnail | Dimensions | User | Comment | |
|---|---|---|---|---|---|
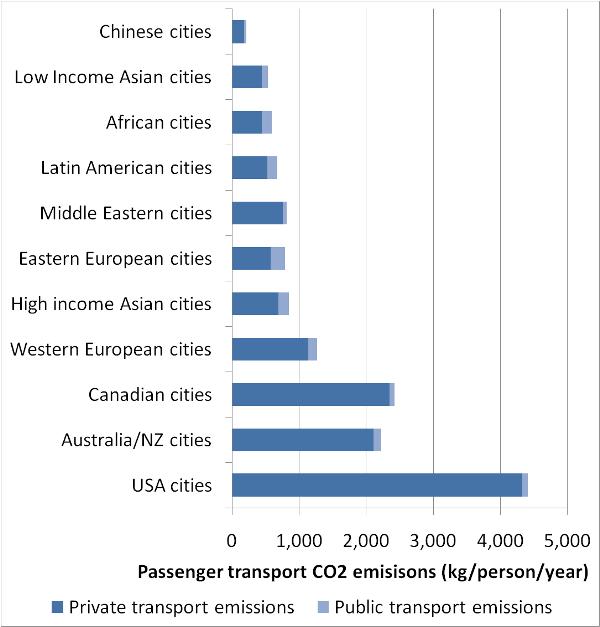
| current | 11:31, 31 July 2009 | | 600 × 627 (46 KB) | commons>Travelplanner | {{Information |Description={{en|1=Graph of CO2 emissions by city for the year 1995. Graph created by me from data published in Kenworthy, JR (2002) Transport Energy Use and Greenhouse Gases in Urban Passenger Transport Systems: A Study of 84 Global Citie |
File usage
There are no pages that use this file.