File:Genetic similarities between 51 worldwide human populations (Euclidean genetic distance using 289,160 SNPs).png
Jump to navigation
Jump to search

Size of this preview: 758 × 599 pixels. Other resolutions: 304 × 240 pixels | 607 × 480 pixels | 971 × 768 pixels | 1,280 × 1,012 pixels | 2,408 × 1,904 pixels.
Original file (2,408 × 1,904 pixels, file size: 414 KB, MIME type: image/png)
.png)

|
This diagram image could be re-created using vector graphics as an SVG file. This has several advantages; see Commons:Media for cleanup for more information. If an SVG form of this image is available, please upload it and afterwards replace this template with
{{vector version available|new image name}}.
It is recommended to name the SVG file “Genetic similarities between 51 worldwide human populations (Euclidean genetic distance using 289,160 SNPs).svg”—then the template Vector version available (or Vva) does not need the new image name parameter. |
| Description |
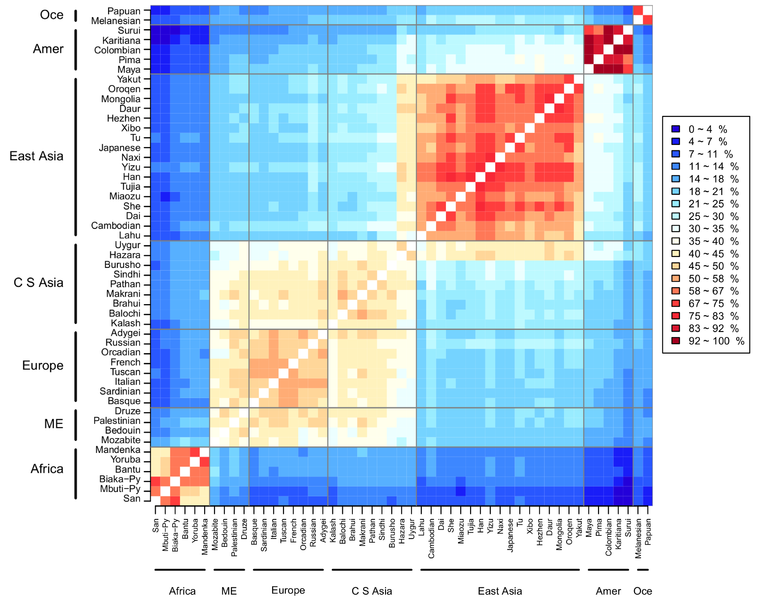
English: Genetic similarities between 51 worldwide human populations, calculated by Euclidean genetic distance using 289,160 SNPs. Each reference is the individual which is the best representative of the HGDP (Human Genome Diversity Project) population. The pair-wise combinations between the 51 references are plotted. The data is normalized so that 100 is given to the most similar pair (plotted in dark red) and 0 is given to the most distant pair (plotted in blue). Vertical and horizontal lines separate the references into large continental groups: sub-Saharan Africa, North-Africa/Middle East, Europe, Central South Asia, East Asia and Oceania.
Five large blocks of similarity are visible:
|
| Date | Published: November 26, 2012 |
| Source | Magalhães TR, Casey JP, Conroy J, Regan R, Fitzpatrick DJ, Shah N, et al. (2012) HGDP and HapMap Analysis by Ancestry Mapper Reveals Local and Global Population Relationships. PLoS ONE 7(11): e49438. doi:10.1371/journal.pone.0049438 http://journals.plos.org/plosone/article?id=10.1371/journal.pone.0049438 |
| Author | Tiago R. Magalhães, Jillian P. Casey, Judith Conroy, Regina Regan, Darren J. Fitzpatrick, Naisha Shah, João Sobral, Sean Ennis |
| Permission (Reusing this file) |
This is an open-access article distributed under the terms of the Creative Commons Attribution License |
|
This file is licensed under the Creative Commons Attribution 2.5 Generic license.
|
This file was published in a Public Library of Science journal. Their website states that the content of all PLOS journals is published under the Creative Commons Attribution 4.0 license (or its previous version depending on the publication date), unless indicated otherwise.
|
File history
Click on a date/time to view the file as it appeared at that time.
| Date/Time | Thumbnail | Dimensions | User | Comment | |
|---|---|---|---|---|---|
| current | 17:02, 13 February 2017 | | 2,408 × 1,904 (414 KB) | commons>Was a bee | {{Information |Description={{en|1=Genetic similarities between 51 worldwide human populations, calculated by Euclidean genetic distance using 289,160 SNPs. Each reference is the individual which is the best representative of the HGDP population. The pa... |
File usage
There are no pages that use this file.
.png)